How to Characterize Nanomaterials Using Basic Lab Techniques
How to Characterize Nanomaterials Using Basic Lab Techniques
Nanomaterials are revolutionizing industries from medicine to electronics, thanks to their unique size-dependent properties. But before you can harness these properties, understanding how to characterize nanomaterials using basic lab techniques is essential. Whether you are a researcher, student, or industry professional, this knowledge ensures you can measure size, shape, composition, and surface properties effectively—without needing high-end instrumentation.
Imagine synthesizing a new nanoparticle for drug delivery. You know it must be smaller than 100 nm for proper cellular uptake, but how can you confirm this in a regular lab? That’s where simple characterization techniques come in—they bridge the gap between theoretical design and practical application.
In this article, we will explore multiple basic lab methods, explain formulas, provide practical examples, and show how these techniques can reliably inform your experiments.
Why Characterizing Nanomaterials Matters
Nanomaterials behave differently from bulk materials because their surface area, quantum effects, and particle size influence their chemical and physical properties. Mischaracterizing a material can lead to:
-
Inefficient performance in electronic or catalytic applications
-
Safety hazards in biomedical or environmental use
-
Misleading experimental results and wasted resources
By mastering simple lab techniques, you gain confidence that your nanomaterial is precisely what you designed, making your research or product development more reliable.

Key Properties to Measure
Before diving into methods, let’s clarify the properties typically analyzed:
-
Particle Size and Distribution – Determines reactivity, solubility, and optical properties.
-
Shape and Morphology – Influences surface interactions and packing.
-
Surface Area – Critical for catalysis and adsorption.
-
Chemical Composition – Ensures the correct elements and functional groups.
-
Optical Properties – Useful for sensors and biomedical applications.
Basic Lab Techniques for Characterization
1. Visual Observation and Colorimetry
For some nanomaterials, color and optical changes can indicate particle formation and approximate size. For example:
-
Gold nanoparticles: Red for ~20 nm, purple for ~50 nm
-
Silver nanoparticles: Yellowish-brown in colloidal solution
Procedure:
-
Dissolve nanoparticles in a solvent like water.
-
Observe color change or use a simple UV–Vis spectrophotometer if available.
-
Compare absorption peaks to known standards.
Practical Example:
Gold nanoparticles (~20 nm) absorb light around 520 nm. By measuring the absorbance, you can roughly estimate size.
Formula for UV–Vis Peak Shift (approximation):
Where λ_max is the wavelength at maximum absorption. This is a simple correlation often sufficient for preliminary checks.
2. Microscopy Techniques
Even without advanced electron microscopes, basic optical microscopes or DIY setups can reveal morphology:
-
Optical microscopy: Limited to particles >200 nm
-
Fluorescence microscopy: Useful for functionalized nanoparticles
-
DIY SEM/AFM alternatives: Some labs use accessible low-cost setups
Step-by-Step Example:
-
Prepare a thin nanoparticle film on a glass slide.
-
Use bright-field or fluorescence microscopy to view morphology.
-
Record images for size distribution analysis using software like ImageJ.
Tip: Take at least 100 particles to calculate an average size for reliability.
3. Dynamic Light Scattering (DLS)
DLS measures particle size distribution in colloidal solutions based on light scattering. While a full DLS instrument might be expensive, some basic lab kits allow approximate measurements.
Procedure:
-
Dilute nanoparticles in a clear solvent to avoid multiple scattering.
-
Shine a laser through the solution.
-
Measure scattered light intensity over time to determine hydrodynamic diameter.
Formula (simplified):
Where:
-
D= diffusion coefficient -
k= Boltzmann constant -
T= temperature (K) -
η= solvent viscosity -
Rh= hydrodynamic radius (related to particle size)
Example: For a water-based nanoparticle at 298 K with η = 0.89 mPa·s and D = 4.4 ×10^-11 m²/s:
This confirms size within the nanoscale.
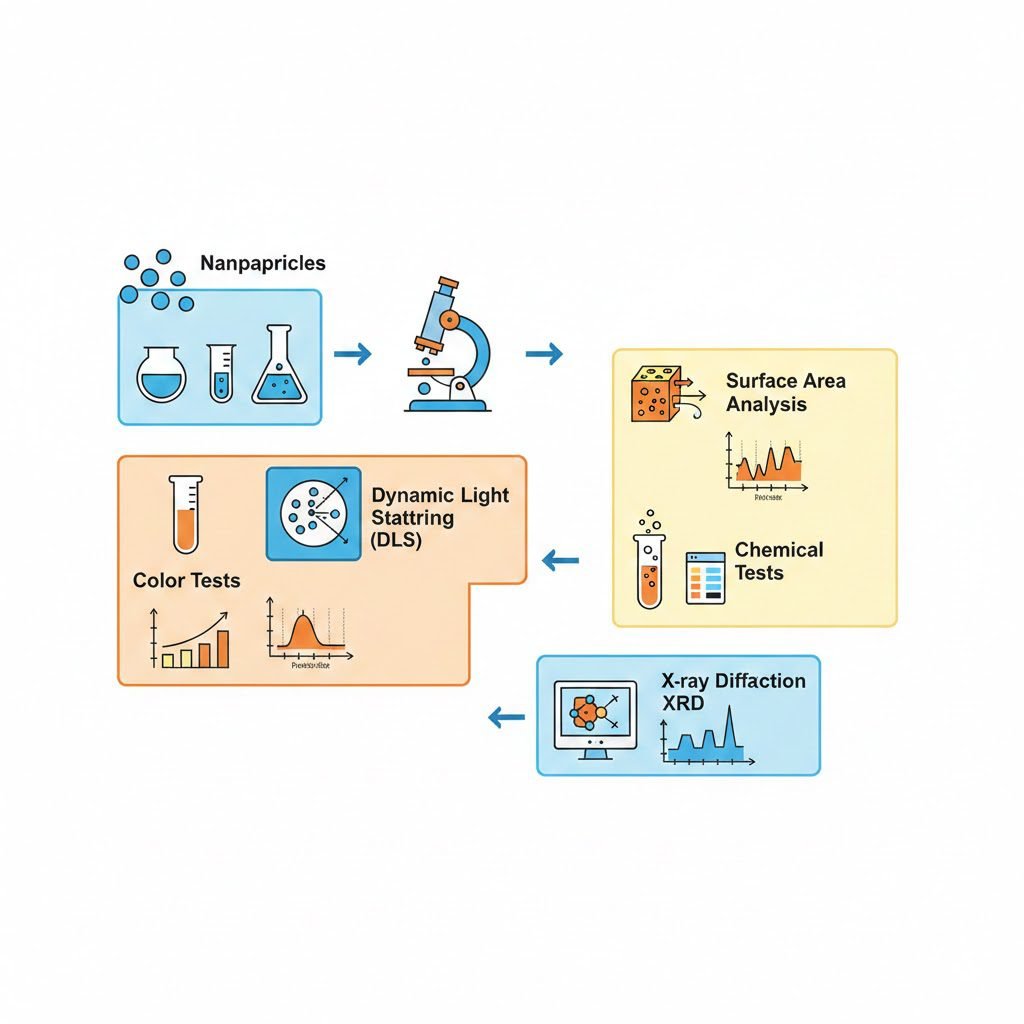
4. Surface Area Measurement Using BET Approximation
For porous nanomaterials, surface area affects catalytic activity and adsorption. You can approximate using nitrogen adsorption/desorption or simpler dye adsorption methods.
Practical DIY Tip: Use methylene blue adsorption:
-
Mix a known volume of methylene blue with nanoparticles.
-
Measure leftover dye concentration after adsorption.
-
Calculate surface area using:
Example: If 0.01 g of nanoparticles adsorbed 1 mL of 10^-5 M methylene blue solution, the approximate surface area is ~50 m²/g.
5. Basic Chemical Composition Analysis
Even simple wet chemistry can confirm functional groups or elements:
-
pH test: Checks acidic or basic surface groups
-
Precipitation reactions: Confirms metal ions
-
Titration: Determines surface charge or reactive groups
Example: To verify silver nanoparticle presence, add NaCl solution: a white precipitate indicates silver ions.
6. X-ray Diffraction (XRD) Basics
If available, a benchtop XRD can provide crystal structure information. For cubic nanocrystals:
Formula for lattice parameter (a) using Bragg’s Law:
Where:
-
d= interplanar spacing -
(h,k,l)= Miller indices
Example: For a peak at θ = 20°, λ = 1.54 Å, (hkl) = (111):
This helps verify crystal size and structure.
Step-by-Step Practical Scenario
Scenario: You synthesized zinc oxide (ZnO) nanoparticles for a photocatalytic experiment.
-
Visual Check: ZnO appears white in powder; confirm no aggregation in water.
-
Microscopy: Optical microscope shows roughly spherical particles 50–70 nm.
-
DLS Measurement: Confirms hydrodynamic diameter ~65 nm.
-
Surface Area: Adsorption of methylene blue gives ~60 m²/g.
-
XRD: Confirms wurtzite crystal structure with expected lattice parameters.
Result: Your nanoparticles meet the required specifications for photocatalytic experiments.
Tips for Accurate Characterization
-
Repeat measurements to minimize experimental error
-
Avoid contamination; even dust affects nanoscale observations
-
Keep detailed logs of methods and concentrations
-
Cross-verify: Combine two techniques, e.g., DLS + microscopy for size
FAQs
1. Can I characterize nanoparticles without expensive instruments?
Yes. Basic lab techniques like visual observation, simple microscopy, colorimetry, and wet chemical tests can provide reliable preliminary information.
2. How do I ensure particle size accuracy?
Use at least two complementary methods, such as DLS and microscopy. Calculate averages and consider standard deviation.
3. Are these methods applicable to all nanomaterials?
Most, but not all. Some specialized materials may require electron microscopy, XPS, or TEM for precise analysis.
Conclusion
Characterizing nanomaterials using basic lab techniques is both practical and essential for reliable experimentation. By understanding particle size, morphology, surface area, and composition, researchers can confidently design applications in medicine, catalysis, or electronics. Start with accessible methods, validate with multiple techniques, and gradually explore advanced tools as needed.
Exploring these approaches not only saves costs but also enhances your hands-on expertise, aligning perfectly with real-world lab applications. For further learning and advanced calculators, visit:
By practicing these methods, you turn theoretical knowledge into practical, actionable insight in the lab.