How to Use UV-Vis Spectrophotometer for Analysis
How to Use UV-Vis Spectrophotometer for Analysis
Imagine you’re in a lab, tasked with verifying the purity of a new batch of pharmaceuticals or assessing the concentration of pollutants in a water sample. Without the right tools, this could be a guessing game, but that’s where the UV-Vis spectrophotometer comes in. This versatile instrument allows you to peer into the molecular world by measuring how substances interact with ultraviolet and visible light. Learning how to use UV-Vis spectrophotometer for analysis isn’t just a technical skill—it’s essential for fields like chemistry, environmental science, and materials engineering, where accurate quantification can make the difference between success and costly errors.
In everyday practice, UV-Vis spectroscopy helps solve real-world problems, from ensuring food dyes are safe to monitoring chemical reactions in real time. It’s straightforward once you grasp the basics, and with proper technique, you can obtain reliable data that informs decisions. Whether you’re a student experimenting for the first time or a professional refining your methods, understanding this tool empowers you to conduct precise analyses. Let’s dive into the principles, operation, and applications to make it approachable and practical.
What is UV-Vis Spectroscopy?
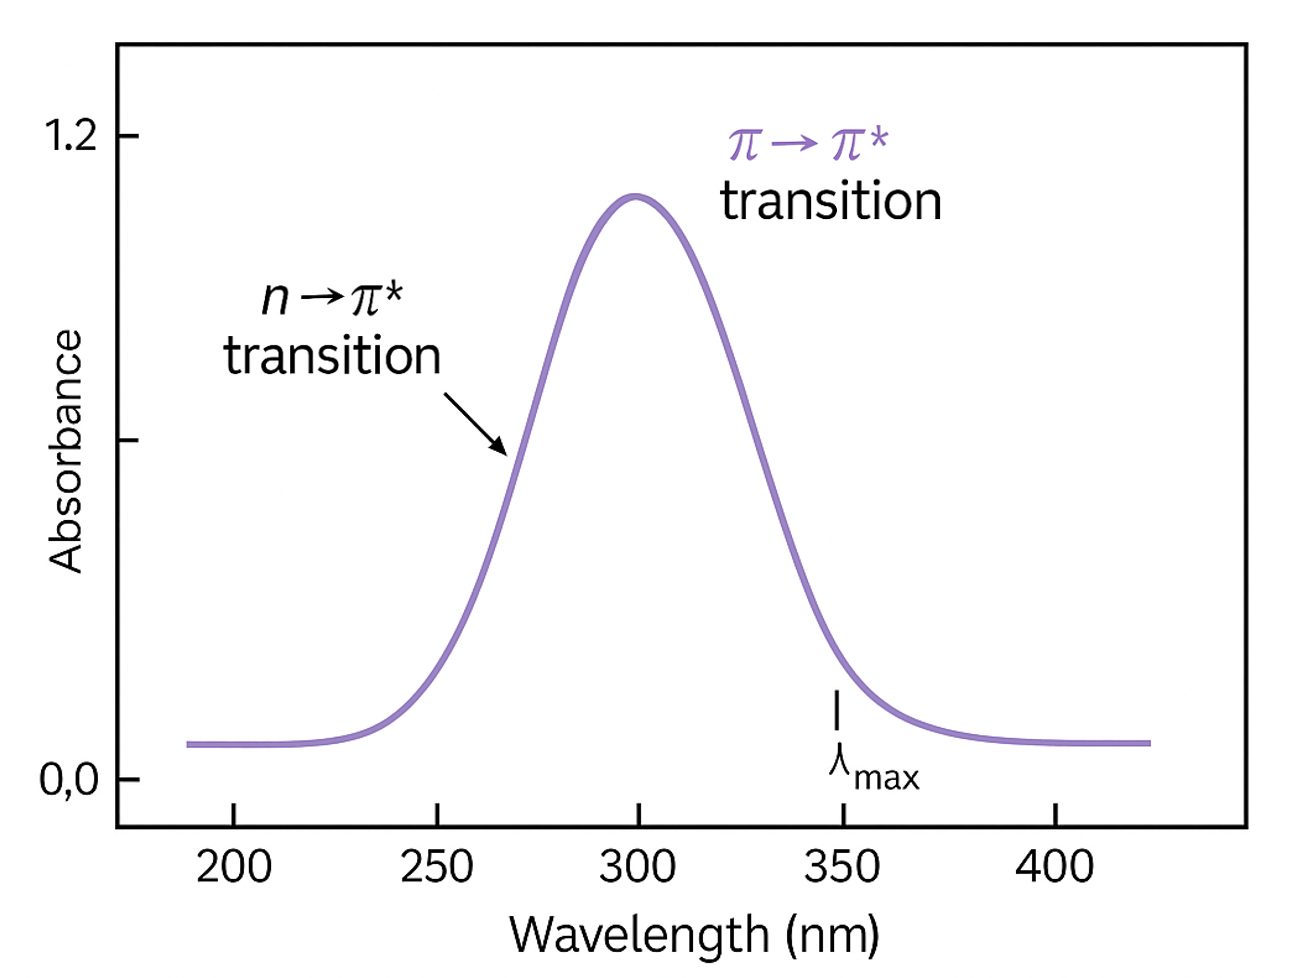
UV-Vis spectroscopy, short for ultraviolet-visible spectroscopy, is an analytical technique that measures the absorption or transmission of light in the ultraviolet (200-400 nm) and visible (400-800 nm) regions of the electromagnetic spectrum. This method is widely used because it’s non-destructive, quick, and requires minimal sample preparation. At its core, it reveals information about the electronic structure of molecules, helping identify and quantify substances based on their unique light absorption patterns.
The technique relies on the fact that certain molecules, known as chromophores, absorb specific wavelengths of light, promoting electrons to higher energy states. This absorption creates a spectrum—a graph of absorbance versus wavelength—that acts like a fingerprint for the compound. For instance, in biochemical labs, it’s commonly used to determine protein concentrations, while in environmental testing, it detects contaminants like heavy metals or organic pollutants.
Beyond basics, UV-Vis is valued for its sensitivity and versatility. It can handle liquid, gas, or even solid samples with appropriate accessories. However, success depends on factors like solvent choice and instrument calibration, which we’ll cover in detail. If you’re working with materials like alloys or polymers, this tool complements other methods—for example, evaluating material degradation as in our guide on how to evaluate corrosion resistance in new alloys.
Principles Behind UV-Vis Spectrophotometry
The foundation of UV-Vis analysis is the Beer-Lambert Law, which describes the linear relationship between absorbance and concentration. Mathematically, it’s expressed as A = ε c l, where:
- A is the absorbance (dimensionless),
- ε is the molar absorptivity (a constant specific to the substance and wavelength, in L/mol·cm),
- c is the concentration (in mol/L),
- l is the path length of the light through the sample (usually 1 cm for standard cuvettes).
This law assumes that light absorption is proportional to the number of absorbing molecules in the beam’s path. Deviations can occur at high concentrations due to molecular interactions, so dilutions are often necessary for accuracy.
Absorbance is calculated from transmittance: A = -log(T), where T = I/I₀ (I is transmitted intensity, I₀ is incident intensity). In practice, this means darker solutions absorb more light, leading to higher absorbance values. Understanding these principles ensures reliable results, especially when analyzing complex mixtures.
Synonymous terms like “UV-visible spectrophotometry” or “absorption spectroscopy” highlight its focus on electronic transitions. For deeper insights into related applications, such as in conductive materials, see our article on how to fabricate flexible electronics with conductive inks.

How the UV-Vis Spectrophotometer Works
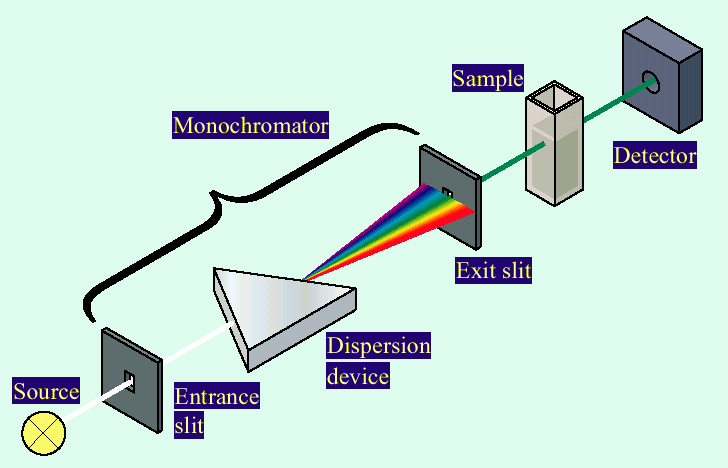
A UV-Vis spectrophotometer is essentially a light-measuring device with inputs, processing, and outputs designed for precise analysis. The primary inputs are the sample (dissolved in a solvent), the reference blank (pure solvent), and user-defined parameters like wavelength range or scan speed.
Internally, the instrument uses a light source (deuterium for UV, tungsten for visible) to emit a broad spectrum. A monochromator selects specific wavelengths, directing the beam through the sample and reference cuvettes. Detectors measure the intensity difference, computing absorbance based on the Beer-Lambert Law.
Outputs include a spectrum plot or numerical data, such as peak absorbance at a chosen wavelength. For example, if you’re quantifying a dye, the logic involves calibrating with known concentrations to build a standard curve, then interpolating your sample’s value using c = A / (ε l).
This process is user-friendly with modern instruments, often featuring software for automated scans. To enhance your understanding, experiment with different inputs—like varying sample dilutions—and observe how outputs change, building intuition for real analyses.
Step-by-Step Guide to Using a UV-Vis Spectrophotometer
Mastering how to use UV-Vis spectrophotometer for analysis involves careful preparation and execution. Here’s a detailed walkthrough:
- Prepare the Instrument: Power on the spectrophotometer and allow it to warm up for 15-30 minutes. This stabilizes the light source for accurate readings. Set the mode to “scan” for full spectra or “fixed wavelength” for single-point measurements.
- Select Wavelength Range: Choose based on your analyte—UV for colorless compounds, visible for colored ones. For a broad scan, set 200-800 nm; for specifics, use known absorption maxima (e.g., 280 nm for proteins).
- Prepare Blank and Sample: Use quartz cuvettes for UV range. Fill the blank with solvent only. Dissolve your sample in the same solvent, ensuring concentration is in the linear range (absorbance 0.1-1.0).
- Calibrate: Insert the blank, close the lid, and zero the instrument (set to 0 absorbance or 100% transmittance).
- Measure Sample: Replace with the sample cuvette, align properly (clear sides facing the beam), and run the scan or measurement.
- Analyze Data: Review the spectrum for peaks. Apply Beer-Lambert Law for quantification.
Always clean cuvettes with solvent rinses to avoid contamination. For eco-friendly applications, like polymer analysis, this pairs well with techniques in how to make eco-friendly coatings from natural polymers.

Practical Examples of UV-Vis Analysis
To illustrate how to use UV-Vis spectrophotometer for analysis, let’s explore three step-by-step examples with real-life relevance.
Example 1: Determining Protein Concentration
Proteins absorb at 280 nm due to aromatic amino acids. This is crucial in biotech for quantifying yields.
- Step 1: Prepare standards (e.g., BSA at 0.1-1 mg/mL in buffer).
- Step 2: Measure absorbance at 280 nm for each.
- Step 3: Plot standard curve: Absorbance vs. concentration (linear fit).
- Step 4: Measure unknown sample; calculate c = A / (ε l), where ε for BSA is ~43,824 M⁻¹cm⁻¹.
In a lab scenario, this confirmed a 0.5 mg/mL enzyme batch, preventing underdosing in reactions. Relevant for readers purifying proteins from natural sources.
Example 2: Quantifying Dye in Food Samples
Food dyes like Red #40 absorb in the visible range (around 500 nm). Used for safety compliance.
- Step 1: Extract dye from sample (e.g., dissolve candy in water).
- Step 2: Create calibration curve with known dye concentrations.
- Step 3: Scan sample; find peak absorbance.
- Step 4: Use A = ε c l to solve for c (ε ~25,000 M⁻¹cm⁻¹ at 502 nm).
Statistics show over 70% of processed foods use dyes; this method ensured a batch met FDA limits. Try varying extraction times to see absorbance changes.
Example 3: Analyzing Nanoparticle Size
Silver nanoparticles show plasmon resonance peaks shifting with size.
- Step 1: Disperse particles in solvent.
- Step 2: Scan 300-600 nm.
- Step 3: Note λ_max (e.g., 400 nm for small particles).
- Step 4: Correlate shift to size using empirical data.
In materials research, this verified 20 nm particles for antimicrobial coatings, tying into corrosion studies. Experiment with aggregations to observe spectral broadening.
Common Applications in Various Fields
UV-Vis is indispensable across industries. In pharmaceuticals, it verifies drug purity; in environmental science, it detects pollutants (e.g., nitrate at 220 nm). Materials scientists use it for polymer characterization, linking to eco-coatings. With over 80% of analytical labs employing it, its role in kinetics—monitoring reaction rates via absorbance changes—is key for process optimization.
FAQs
What is the difference between UV and Vis ranges in spectrophotometry?
UV (200-400 nm) targets electronic transitions in unsaturated bonds, ideal for colorless samples. Vis (400-800 nm) handles colored compounds. Choose based on your analyte’s chromophores for best results.
How do I troubleshoot high absorbance readings?
Dilute the sample to stay within 0.1-1.0 absorbance. Check for bubbles or dirty cuvettes. Tip: Always run a baseline correction first.
Can UV-Vis be used for solid samples?
Yes, with reflectance accessories. It’s great for films or powders, expanding to applications like alloy coatings.
Conclusion
In summary, mastering how to use UV-Vis spectrophotometer for analysis involves understanding the Beer-Lambert Law, proper instrument operation, and data interpretation for quantitative insights. From protein assays to nanoparticle sizing, it’s a powerhouse for precise, non-invasive testing.
I encourage you to grab a sample, run your own scans, and tweak variables like concentration to see the principles in action. Explore our related resources for more hands-on guides—this tool’s value lies in its everyday problem-solving potential, making complex analyses accessible and trustworthy.