How to Analyze Mass Spectrometry Data Basics
How to Analyze Mass Spectrometry Data Basics
Understanding how to analyze mass spectrometry data basics is essential for anyone working in chemistry, biochemistry, pharmaceuticals, or environmental science. Imagine you’ve just run a sample through a mass spectrometer, and the machine spits out a complex spectrum. Without knowing how to read it, all that data is just a confusing wall of peaks. This article will guide you through the fundamentals, helping you turn raw data into actionable insights with confidence.
What Is Mass Spectrometry and Why It Matters
Mass spectrometry (MS) is an analytical technique used to identify compounds based on their mass-to-charge ratio (m/z). It’s widely used in drug discovery, forensic analysis, and quality control. Essentially, MS allows you to:
-
Determine the molecular weight of unknown compounds.
-
Analyze complex mixtures quickly.
-
Detect trace amounts of substances with high sensitivity.
Practical scenario: Suppose a pharmaceutical lab needs to confirm the identity of a newly synthesized drug. Mass spectrometry can rapidly verify its molecular structure and purity, saving hours of tedious manual testing.

How Mass Spectrometry Works
Understanding the process helps make sense of the data you’ll see:
-
Ionization – The sample is converted into charged particles (ions). Common methods include Electrospray Ionization (ESI) and Matrix-Assisted Laser Desorption/Ionization (MALDI).
-
Mass Analyzer – Ions are separated based on their mass-to-charge ratio (m/z). Popular analyzers include Quadrupole, Time-of-Flight (TOF), and Orbitrap.
-
Detector – Measures the number of ions at each m/z, producing a spectrum of peaks.
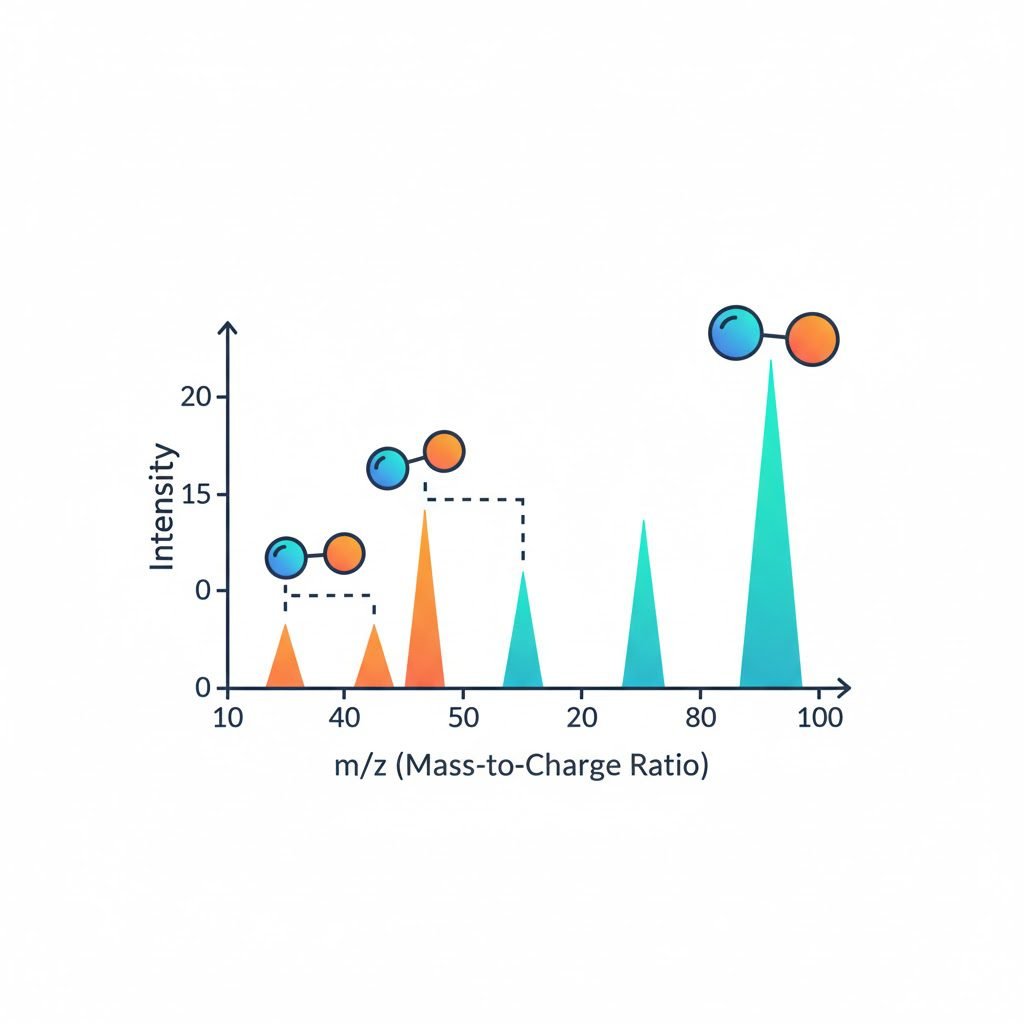
Key takeaway: The height of each peak reflects the relative abundance of ions, and the position corresponds to their mass-to-charge ratio.
Step-by-Step Guide to Reading Mass Spectrometry Data
1. Identify the Molecular Ion Peak
-
Look for the highest m/z value with significant intensity. This often represents the molecular ion (M⁺), giving the molecular weight of the compound.
-
Example: If the molecular ion peak appears at m/z = 180, your compound likely has a molecular weight of 180 g/mol.
2. Examine Isotopic Patterns
-
Elements like chlorine (Cl) or bromine (Br) have characteristic isotopic peaks.
-
Chlorine, for instance, shows a 3:1 ratio between its M and M+2 peaks.
-
Recognizing these patterns helps confirm elemental composition.
3. Analyze Fragmentation Peaks
-
Fragment peaks appear at lower m/z values and reveal the compound’s structure.
-
Example: If a peak appears at m/z = 105 for a compound with M⁺ = 180, the fragment might represent the loss of a specific functional group.
4. Calculate Relative Abundance
-
Relative intensity =
(peak height / base peak height) × 100% -
The base peak is the tallest peak, set at 100% relative abundance.
5. Cross-Check with Databases
-
Use tools like NIST Mass Spectral Library or online databases to compare spectra for confirmation.
-
This step strengthens confidence in compound identification and reduces experimental errors.
Practical Examples
Example 1: Identifying a Simple Organic Compound
-
Molecular ion peak at m/z 58.
-
Fragment peak at m/z 43 (loss of -CH₃ group).
-
Interpretation: Likely acetone, molecular weight 58 g/mol.
Example 2: Detecting Isotopic Elements
-
Peaks at m/z 100 and 102 in a 3:1 ratio.
-
Interpretation: Compound contains chlorine.
Example 3: Mixture Analysis
-
Peaks at m/z 180, 194, and 208.
-
Interpretation: Sample contains multiple compounds.
-
Action: Compare each molecular ion with reference spectra to identify components.
Tips for Accurate Data Interpretation
-
Always calibrate your instrument before analyzing samples.
-
Use high-resolution mass spectrometry for complex mixtures.
-
Record replicates to ensure data reliability.
-
Combine MS with chromatography (GC-MS or LC-MS) for separation of complex samples.
FAQs
Q1: Can mass spectrometry detect impurities?
Yes. Impurity peaks appear at m/z values different from the main compound. Comparing relative abundance helps quantify impurities.
Q2: How do I choose the right ionization method?
Select based on sample type. For small polar molecules, ESI works well; for large biomolecules, MALDI is preferred.
Q3: What’s the difference between low-resolution and high-resolution MS?
Low-resolution MS provides approximate m/z values, while high-resolution MS gives exact mass measurements, crucial for identifying elemental composition.
Conclusion
Learning how to analyze mass spectrometry data basics transforms a wall of peaks into meaningful insights. By understanding molecular ion peaks, isotopic patterns, fragmentation, and relative abundance, you can confidently identify compounds and solve real-world laboratory problems. Experiment with different samples, compare spectra with trusted databases, and integrate chromatography for complex analyses to maximize the power of your mass spectrometry tool.